
The scientific researchers from the University of Sao Paulo Brazil in collaboration with the XAFS/XRF beamline staff of SESAME studied the atomic structure order of emission color-tunable quantum confined semiconductor nanocrystals, which are of immense research interest in nanosized optoelectronics, medical theranostic (combination of therapeutics and diagnostic). Since, the optoelectronic properties of semiconductor quantum dots (QDs) originate from size-dependent quantum confinement effect in individual nanocrystal that leads to novel exciton generation and recombination in intra-bandgap with tunable emission. The authors reported a new approach to engineer ultrasmall CdSe/ZnS core/shell nanocrystals of similar size with tunable emission from blue to orange colors. The quantitative XAFS studies at SESAME were performed to probe the local atomic structure order and understand the nature of alloying at interface via anion exchange (Se2- by S2- anion) in core/shell lattice of QDs that governs the blue shift in emission. These QDs act as remarkable photosensitizers for singlet molecular oxygen (1O2) generation, which is a key component of targeted photodynamic therapy. This study will open new possibilities of band-edge engineering and developing the QDs-based theranostic’ nanoprobes for simultaneous fluorescence bioimaging and photodynamic therapy in biomedicine.
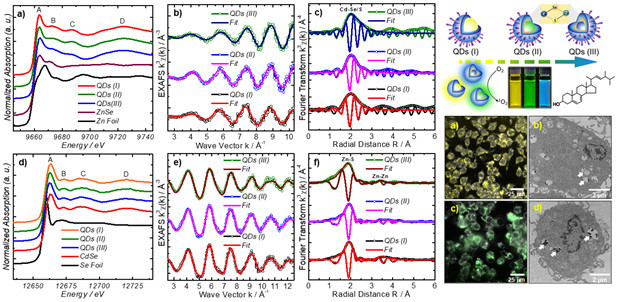
X-ray absorption spectroscopy: XANES spectra at the Se K-edge (12658 eV) (a) and Zn K-edge (9659 eV) (d). The k3-weighted experimental EXAFS signals and respective Fourier transforms with best fits at the Cd K-edge (26711 eV) (b,c) and Zn K-edge (9659 eV) (e,f) for the core/shell lattices of orange QDs (I), green QDs (II) and blue emitting QDs (III), showing both the amplitude and the real parts of the Fourier transforms of the data [χ(k)] and the fits. Microscopy imaging (bottom right): CytoViva enhanced dark-field and dual-mode fluorescent (DMF) images’ overlays of live cells stained with QDs (I) (a) and QDs (II) (c), respectively. The TEM images show the intracellular localization of QDs (I) (b) and QDs (II) (d) as dark features indicated by white arrows.
The full article may be found at https://doi.org/10.1021/acsanm.2c05482